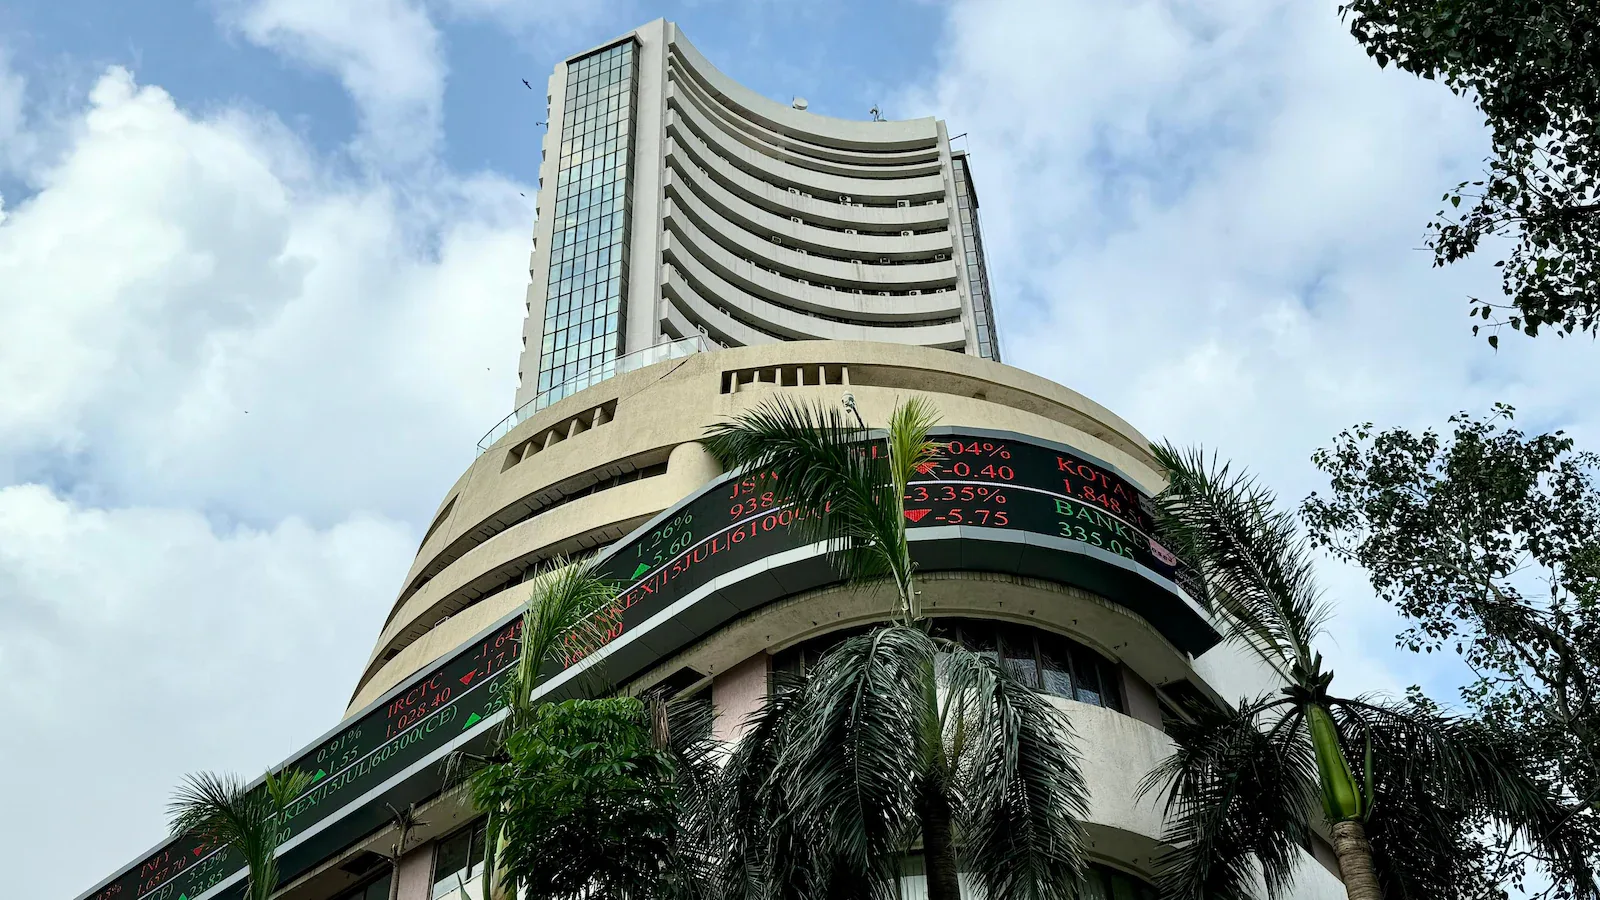
Nifty 50 Gains 1.66% on October 15, Key Levels to Watch
The Nifty 50 index surged significantly, marking its largest single-day gain in four months, prompting cautious optimism among traders.

Nifty 50 rose 1.66%, reclaiming key moving averages.
Resistance levels identified at 23,000 and 23,300; support at 22,600.
Market sentiment indicated by a surge in the Put-Call ratio to 1.37.
On October 15, the Nifty 50 index experienced a remarkable increase of 1.66%, achieving its most substantial single-day gain in four months. This rally allowed the index to reclaim its 20-day exponential moving average (EMA) and the midline of the Bollinger Bands, signaling a potential shift in market momentum towards buyers. Despite this positive movement, analysts caution that the overall trend remains weak, as the index continues to trade below both its 50-day and 200-day EMAs. A sustained move above the 22,850 mark could pave the way for further advances towards 23,000 and potentially 23,300–23,350, which are viewed as critical resistance zones. Conversely, failure to maintain levels above 22,850 may result in further consolidation, with support identified in the 22,700–22,600 range.
In terms of technical indicators, the Nifty 50 formed a long bullish candle on the daily chart, closing above its short-term moving averages. The Relative Strength Index (RSI) approached the neutral mark of 50, indicating a bullish crossover, while the Moving Average Convergence Divergence (MACD) maintained a positive crossover. These indicators suggest a short-term bullish momentum, although the broader trend remains a concern due to the index's position below longer-term moving averages.
For the Bank Nifty, which closed at 55,810, resistance levels are noted at 56,019, 56,204, and 56,505, while support levels are at 55,418, 55,232, and 54,932. The Bank Nifty also exhibited a bullish candle formation, reinforcing a positive bias despite some selling pressure. The index's RSI rose to 51.59, indicating a bullish crossover as well, and the MACD remained above its signal line, suggesting improving bullish sentiment in the near term.
The options data reveals that the 23,000 strike has the highest Call open interest, indicating it may serve as a significant resistance level for the Nifty in the near future. Additionally, the maximum Put open interest is observed at the 22,500 strike, suggesting it may act as a crucial support level. The Put-Call ratio surged to 1.37, the highest since early August, reflecting a bullish sentiment among traders as more Put options are being sold compared to Call options.
Looking ahead, traders are advised to monitor key resistance and support levels closely. With the market showing signs of bullish momentum, the upcoming trading sessions will be critical in determining whether this trend can be sustained or if caution is warranted due to the underlying weak broader trend.